Tables
a02_tables.RmdTo make a table, you can use the sdcoe_table() function.
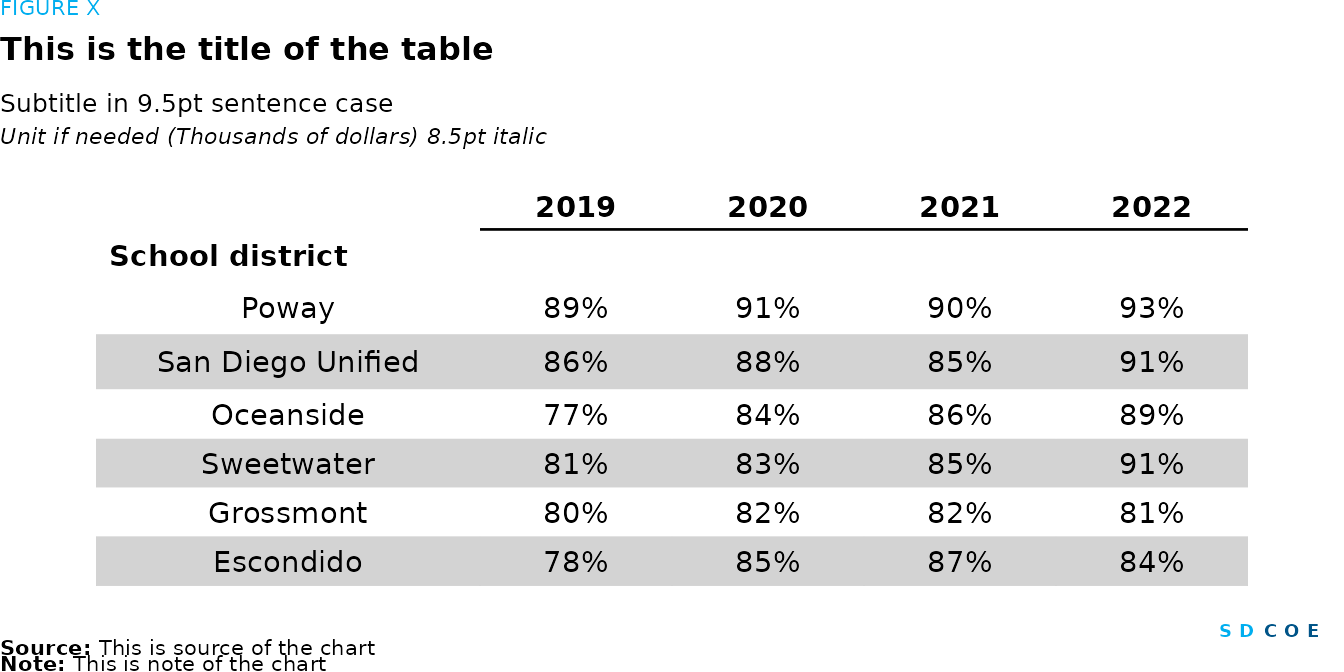
First, let’s create some fake data.
data <- tibble(
  `School district` = c("Poway", "San Diego Unified", "Oceanside", "Sweetwater", "Grossmont", "Escondido"),
  `2019` = c("89%", "86%", "77%", "81%", "80%", "78%"),
  `2020` = c("91%", "88%", "84%", "83%", "82%", "85%"),
  `2021` = c("90%", "85%", "86%", "85%", "82%", "87%"),
  `2022` = c("93%", "91%", "89%", "91%", "81%", "84%")
)
Next, we use the sdcoe_table() function. We can use
additional functions from the flextable package in order to
customize the table beyond what the sdcoe_table() function
does.
# Create a table
table <-
  sdcoe_table(data,even_body = "lightgray",odd_body = "white") |>
  # Set header
  set_header_labels(
    "School district" = ""
  ) |>
  # Add second header at the bottom of the first header
  add_header(
    `School district` = "School district",
    `2019` = "",
    `2020` = "",
    `2021` = "",
    `2022` = "",
    top = FALSE
  ) |>
  # Align the first column name to the left
  align(i = 2, j = NULL, align = "left", part = "header") |>
  # Remove all borders
  border_remove() |>
  # Add bottom border to the top header
  border(
    part = "header",
    i = 1,
    j = 2:5, border.bottom = fp_border(color = "black")
  ) |>
  # Set the first column width to 2
  width(width = 2, j = 1)

table
2019 |
2020 |
2021 |
2022 |
|
|---|---|---|---|---|
School district |
||||
Poway |
89% |
91% |
90% |
93% |
San Diego Unified |
86% |
88% |
85% |
91% |
Oceanside |
77% |
84% |
86% |
89% |
Sweetwater |
81% |
83% |
85% |
91% |
Grossmont |
80% |
82% |
82% |
81% |
Escondido |
78% |
85% |
87% |
84% |
To make the table in full SDCOE style, we first have to save it as a
grob before using various sdcoe_ functions to add
elements.
# Convert the table to a grob object for plotting
table <- gen_grob(table, fit = "fixed", just = "centre")

# Create SDCOE plot with annotations and formatting
sdcoe_plot(sdcoe_figure("FIGURE X"),
  # Add title
  sdcoe_title("This is the title of the table"),
  # Add subtitle
  sdcoe_subtitle("Subtitle in 9.5pt sentence case"),
  # Add y-axis title
  sdcoe_y_title("Unit if needed (Thousands of dollars) 8.5pt italic"),
  # Add the previously created plot
  table,
  # Add SDCOE logo
  sdcoe_logo_text(),
  # Add data source
  sdcoe_source("This is source of the chart"),
  # Add note
  sdcoe_note("This is note of the chart"),
  # Set layout parameters
  ncol = 1, heights = c(2, 5, 1, 1, 30, 1, 1, 1)
)